Card services such as Open Street Map or Google Map are really a fine and useful thing. You can easy enter some coordinates and display them, display a route and so on.
But what to do when there is no net available, such as on the high seas or somewhere in the middle of the wilderness? Either you spend a lot of money and get a satellite connection, or you build your own little map server with only a few handles.
The things that you need to do this are all freely available - that is Apache as a web server, MapServer to generate the graphics and OpenLayers to install the graphics in a Web site. Furthermore, you need shapefiles from the area where you want to put the map service.
These can also be found free on the Internet. Or you get the appropriate Shape Files from Open Street Map, provided by Geofabrik .
These shape files are, however, very finely resolved and then you need a little computing power to render the desired images.
I describe here, the installation and configuration on a Raspberry Pi as a mobile map-server.
1. Install Software
So to set up the map server on the Raspberry, you first have to install the necessary software:
apt-get install apache2 cgi-mapserver gdal-bin
2 Get the Shape files
Now get the desired shape files. I just needed the coastlines of Europe and so I have found this shape:
This shape has also a not too high resolution and therefore runs on the Raspberry fairly smooth. Even though the file is called world.zip, it is really only Europe :-)
Then create a folder in the user's home directory for the Shape files and unzip them into the folder.
mkdir/home/pi/shapes
mkdir/home/pi/shapes/eu
mv world.zip /home/pi/shapes/eu
cd /home/pi/shapes/eu
unzip world.zip
After that the following files should appear in this directory:
pi@raspberrypi ~/shapes/eu $ ls -l
insgesamt 456
-rw-rw-r-- 1 pi pi   9062 Jul 14 19:54 MyEurope.dbf
-rw-rw-r-- 1 pi pi    145 Jul 14 19:54 MyEurope.prj
-rw-rw-r-- 1 pi pi    452 Jul 14 19:54 MyEurope.sbn
-rw-rw-r-- 1 pi pi    148 Jul 14 19:54 MyEurope.sbx
-rw-rw-r-- 1 pi pi 299032 Jul 14 19:54 MyEurope.shp
-rw-rw-r-- 1 pi pi   1795 Jul 14 19:54 MyEurope.shp.xml
-rw-rw-r-- 1 pi pi    364 Jul 14 19:54 MyEurope.shx
-rw-r--r-- 1 pi pi 131025 Jul 14 19:53 world.zip
pi@raspberrypi ~/shapes/eu $
3. Configure MapServer
The MapServer itself does not need to be configured, but only the maps and layers, which he is supposed to create. This is done by the setup of so-called Map-Files.
To be able to setup these files properly, you first need some information about the shape.
For this informations the command ogrinfo is used. This is part of the gdal-bin package, which was already installed.
pi@raspberrypi ~/shapes/eu $ ogrinfo MyEurope.shp
INFO: Open of `MyEurope.shp'
      using driver `ESRI Shapefile' successful.
1: MyEurope (Polygon)
This provides first information on which layers are included in this shape. In this case, it is just one layer with the name MyEurope. Now you need more information about this layer.
These can be get with
pi@raspberrypi ~/shapes/eu $ ogrinfo MyEurope.shp MyEurope -summary
INFO: Open of `MyEurope.shp'
      using driver `ESRI Shapefile' successful.

Layer name: MyEurope
Geometry: Polygon
Feature Count: 33
Extent: (-31.289030, 27.637497) - (30.128712, 69.060303)
Layer SRS WKT:
GEOGCS["GCS_WGS_1984",
    DATUM["WGS_1984",
        SPHEROID["WGS_84",6378137.0,298.257223563]],
    PRIMEM["Greenwich",0.0],
    UNIT["Degree",0.0174532925199433]]
FIPS_CNTRY: String (2.0)
GMI_CNTRY: String (3.0)
CNTRY_NAME: String (40.0)
SOVEREIGN: String (40.0)
POP_CNTRY: Integer (10.0)
SQKM_CNTRY: Real (12.3)
SQMI_CNTRY: Real (12.3)
CURR_TYPE: String (16.0)
CURR_CODE: String (4.0)
LANDLOCKED: String (1.0)
COLOR_MAP: String (1.0)
Pop2011CIA: Integer (9.0)
Pop2000Wik: Integer (9.0)
url: String (100.0)
pi@raspberrypi ~/shapes/eu $
The three pieces of information that are needed necessarily for the mapfile are Geometry, Extent and Layer SRS WKT. Here stands for the date "WGS_84".
Now we can create the first simple mapfile.
For this, we create a directory and create the file eu.map
mkdir /home/pi/maps
nano /home/pi/maps/eu.map
In this file simply enter the following code.
MAP
  # Name of the Map.
  NAME "Europa"

  # Path to the Shape-Files
  SHAPEPATH "/home/pi/shapes/eu/"

  # Size of the Image
  SIZE 800 600

  # The Extend-Values of the Shape-File
  EXTENT -31.289030 27.637497 30.128712 69.060303

  # Type of the Image. You could take more than one ..
  IMAGETYPE PNG

        # The Projektion of the Shape. WGS_84 = epsg:4326
        # The EPSG-Values of a Projections can be found in the Net
	PROJECTION
	  "init=epsg:4326"
	END

	WEB
	    IMAGEPATH "/var/www/tmp/"
	    IMAGEURL  "/tmp/"
	    METADATA
	    	"wms_enable_request" "*"
	    END
	END

  # Definition of a Layer
  LAYER
    NAME europe
    DATA MyEurope
    STATUS ON
    # Type of the Shape - output was POLYGON
    TYPE POLYGON

    PROJECTION
      "init=epsg:4326"
    END

    METADATA
      "wms_title"           "Coastlines Europe"
    END
    CLASS
      STYLE
        COLOR 0 0 0
        OUTLINECOLOR 0 0 0
      END
    END
  END
END
These map files are usually much larger and arbitrarily complicated, but for this example this map file is already sufficient. More information about the Map-Fies can be found on the homepage of MapServer.
Now save the file with ctrl+o and exit the editor ctrl+x. That's it.
Time for a first test:
If you followed the example and depending on where Apache and Mapserver are installed, the address needs to be adjusted - for example with localhost or IP of the Raspberry.
So open the browser and enter the following link in the address bar:
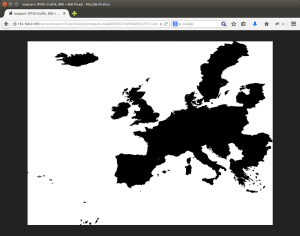
http://ip-of-server/cgi-bin/mapserv?map=/home/pi/maps/eu.map&SERVICE=WMS...
And if all goes goes right, the following screen should appear after a short time.
[caption id="attachment_788" align="aligncenter" width="300"] First Test with the Mapserver[/caption]
Update:
To make the request clear and not having to specify the map file each time, you can select the following option (described here for Debian / Ubuntu):
Renames the file mapserv in the cgi-bin directory to the name of your WMS service, for example
cp /usr/lib/cgi-bin/mapserv /usr/lib/cgi-bin/my-wms
Then you mus add the following lines in the configuration file of your web server:
For Apache the file /etc/apache2/sites-available/default.conf or the corresponding file
#MapServer applications
SetEnvIf Request_URI "/cgi-bin/my-wms" map=/home/pi/maps/eu.map
After that the request looks like this:
http://ip-of-server/cgi-bin/my-wms?SERVICE=WMS&REQUEST=Getmap&VERSION=1....
Now we have a base map. But this is still completely static. To make the card now interactive and fill it with a bit of life, we need OpenLayers. OpenLayers is a JavaScript library and actually corresponds to what is the Google Maps Api for Google.
So lets build a simple HTML file together with Open Layers:
<!DOCTYPE HTML PUBLIC "-//W3C//DTD HTML 4.0 Transitional//EN">
<html>
<head>
<style type="text/css">
div.olControlMousePosition { color: red; }
</style>
<script type="text/javascript" src="http://openlayers.org/api/OpenLayers.js"></script>
<script type="text/javascript">
function init(){
var center = new OpenLayers.LonLat(10, 49.5);
var map = new OpenLayers.Map( 'map' );
var baseLayer = new OpenLayers.Layer.MapServer( "Europe Map", "http://ip-of-servers/cgi-bin/mapserv", {map: '/home/pi/maps/eu-test.map', layers: 'europe', srs: 'EPSG:4326', visibility: true } );
map.addLayer(baseLayer);
var markers = new OpenLayers.Layer.Markers( "Markers" );
map.addLayer(markers);
var myMarker = new OpenLayers.Marker(new OpenLayers.LonLat(13, 52.5));
//here add mouseover event
myMarker.events.register('mouseover', myMarker, function(evt) {
popup = new OpenLayers.Popup.FramedCloud("Popup",
new OpenLayers.LonLat(13, 52.5),
null,
'<div>Hallo Welt. Gruß aus Berlin</div>',
null,
false);
map.addPopup(popup);
});
//here add mouseout event
myMarker.events.register('mouseout', myMarker, function(evt) {popup.hide();});
markers.addMarker(myMarker);
map.addControl( new OpenLayers.Control.Zoom() );
map.addControl(new OpenLayers.Control.MousePosition());
map.setCenter( center, 4 );
}
</script>
</head>
<body onload="init()">
<p><h1>Erstes Beispiel</h1><p>
<div id="map" style="width:800px;height:600px"></div>
</body>
</html>
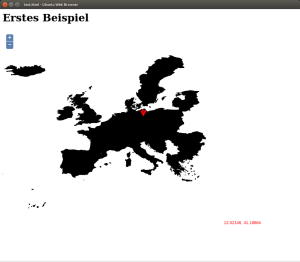
If you open this HTML-file now in the browser, you should see something like this:
Our map with a zoom control top left, a marker with a popup and a display of the mouse position at the bottom right.
[caption id="attachment_797" align="aligncenter" width="300"] Erstes HTML-Beispiel mit OpenLayers[/caption]
Now you can play around and add more marker, Layers, or what whatever you want to the map.
You can see my final product here ( Race Tracker ). As additional WMS-layer there is a map from OpenWeatherMap with the current wind-speed. This is a race tracker from the "Round Britain and Ireland" race.
Due to construction the server with the race-tracker is not available at the moment.
More information on OpenLayers can be found on openlayers.org a>
Add comment